Originally published to Medium.com
As a member of the Patrick J. McGovern Foundation’s (PJMF) 2023 Data to Safeguard Human Rights Accelerator program, FishWise and PJMF’s Data Practice team have partnered to create a streamlined and systematic means of detecting human and labor rights risks in seafood supply chains.
by Adzan Adlan, Nahla Achi, Chris Young, and Sara Lewis
Seafood companies are increasingly committed to responsible sourcing and are working to counter illicit behavior in their supply chains. However, current methodologies to assess illegal, unreported, and unregulated (IUU) fishing, human, and labor rights risks in seafood supply chains are resource-intensive, lack access to vessel-level data, and lack the crucial analysis necessary to translate data insights into subsequent actions for companies. Leveraging data to inform and prioritize action on human rights is essential for companies to meet their industry sustainability commitments. Many human and labor rights violations occur far from shore, and vessel data can provide us with eyes and ears closer to the water to help illuminate suspicious activity in supply chains and inform responsible sourcing decisions.
In the past, FishWise addressed gaps in data analysis and data-informed recommendations for companies by using Global Fishing Watch’s Vessel Viewer. Vessel Viewer provided essential vessel-level data and preliminary data insights, allowing us to offer seafood companies actionable recommendations. While this data approach served our team for a time, the workflow was time-consuming, especially in cases like shelf-stable tuna, where sourcing could come from over 100 different vessels. It became clear that we had to rethink our data strategy.

Introduction to the Accelerator Project
We found a gap in the seafood sustainability space for a scalable vessel analytics solution that detects the presence of specific risk indicators. The main features of this analytics solution would include integrated, traceable seafood sourcing data, detailed vessel identity and activity data, and visualized key indicators of human and labor rights risks on an interactive dashboard.
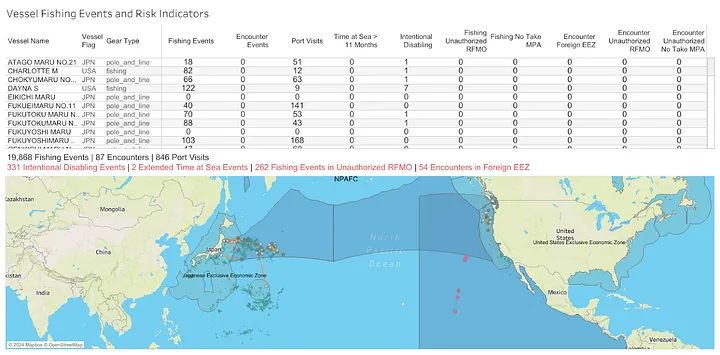
For this project, FishWise used multiple application programming interfaces (APIs) from Global Fishing Watch to extract detailed vessel identity, activity, and fishing event data. Decisions, a no-code rules engine, was used to retrieve and process API calls and evaluate the data against leading indicators of human and labor rights risks. The result was interactive Tableau dashboards to visually illuminate potentially illicit activity in seafood companies’ supply chains.
To produce this proof of concept, we did the following:
- Collected a vessel list with vessel names and other identifiers (e.g., International Maritime Organization (IMO) number, Maritime Mobile Service Identities (MMSI) number)
- Found matches for vessels in the list via Global Fishing Watch’s vessel search API
- Retrieved all vessel events for vessels in the list over our defined time period (2022) by querying the Global Fishing Watch Events API and retrieved insights from all vessels in the list by querying the Global Fishing Watch Insights API to highlight potential risk events
- Retrieved port visit events data to calculate time-at-sea for vessels in the list for an extended period (2018–2022)
- Parsed the aggregated event string for each vessel into discrete events and loaded them into event tables in Redshift
- Stored indicators into the insights table in Redshift and stored port visits into the time-at-sea table
- Constructed materialized views to join insights and event tables for tables of individual indicators (materialized views are the final table views for use in our Tableau visualizations)
- Loaded GeoSpatial polygons to display exclusive economic zones (EEZ), regional fisheries management organization (RFMO) zones, and marine protected areas (MPA)
- Defined relationships between vessel source tables and created materialized views (in Redshift) for Tableau
- Configured the data source as an extract to improve rendering/retrieval speeds (When working with an extract, we refreshed it whenever there were updates to the materialized views and source tables via API.)
With these steps completed, we created the automated vessel risk indicator dashboards in Tableau. This vessel analytics solution will help retailers and suppliers implement due diligence to identify and address human and labor rights risks in supply chains.

